GUIDE-seq: The GUIDE-Seq Analysis Package
Contents:
Summary
The guideseq package implements our data preprocessing and analysis pipeline for GUIDE-Seq data. It takes raw sequencing reads (FASTQ) and a parameter manifest file (.yaml) as input and produces a table of annotated off-target sites as output.
Steps
The package implements a pipeline consisting of a read preprocessing module followed by an off-target identification module. The preprocessing module takes raw reads (FASTQ) from a pooled multi-sample sequencing run as input. Reads are demultiplexed into sample-specific FASTQs and PCR duplicates are removed using unique molecular index (UMI) barcode information.
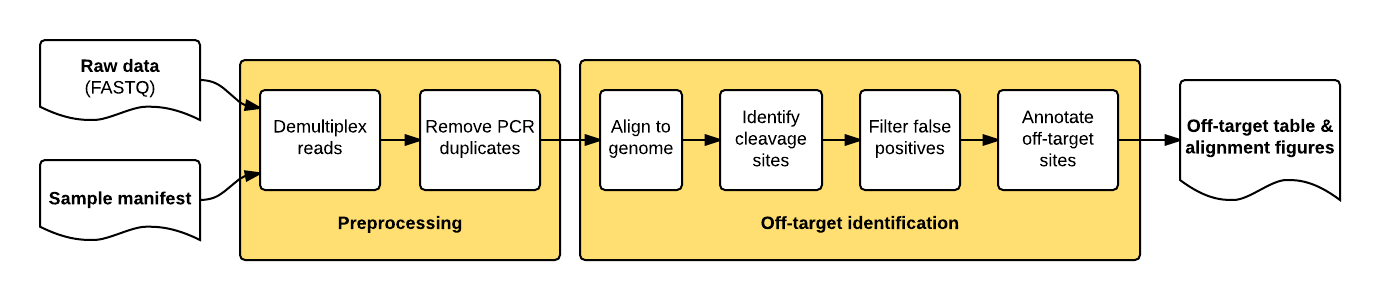
The individual pipeline steps are:
Sample demultiplexing: A pooled multi-sample sequencing run is demultiplexed into sample-specific read files based on sample-specific dual-indexed barcodes
PCR Duplicate Consolidation:Reads that share the same UMI and the same first six bases of genomic sequence are presumed to originate from the same pre-PCR molecule and are thus consolidated into a single consensus read to improve quantitative interpretation of GUIDE-Seq read counts.
Read Alignment: The demultiplexed, consolidated paired end reads are aligned to a reference genome using the BWA-MEM algorithm with default parameters (Li. H, 2009).
Candidate Site Identification: The start mapping positions of the read amplified with the tag-specific primer (second of pair) are tabulated on a genome-wide basis. Start mapping positions are consolidated using a 10-bp sliding window. Windows with reads mapping to both + and - strands, or to the same strand but amplified with both forward and reverse tag-specific primers, are flagged as sites of potential DSBs. 25 bp of reference sequence is retrieved on either side of the most frequently occuring start-mapping position in each flagged window. The retrieved sequence is aligned to the intended target sequence using a Smith-Waterman local-alignment algorithm.
False positive filtering: Off-target cleavage sites with more than six mismatches to the intended target sequence, or that are present in background controls, are filtered out.
Reporting: Identified off-targets, sorted by GUIDE-Seq read count are annotated in a final output table. The GUIDE-Seq read count is expected to scale approximately linearly with cleavage rates (Tsai et al., Nat Biotechnol. 2015).
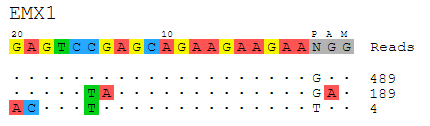
Visualization: Alignment of detected off-target sites is visualized via a color-coded sequence grid, as seen below:
Installation
The most easiest way to install guideseq pipeline is via conda.
conda create -n guideseq -c conda-forge -c bioconda -c anaconda -c tsailabSJ guide_seq

source activate guideseq

guideseq.py -h

## BWA and bedtools are automatically installed
Alternatively, you can git clone this repository and install
git clone https://github.com/tsailabSJ/guideseq

cd guideseq

pip install -r requirements.txt

python setup.py install

guideseq.py -h

## Please install BWA and bedtools if you choose this option
Burrows-Wheeler Aligner (bwa): You can either install bwa with a package manager (e.g. brew on OSX or apt-get on Ubuntu/Debian), or you can download it from the [project page](http://bio-bwa.sourceforge.net/) and compile it from source.
Bedtools: You can either install bwa with a package manager (e.g. brew or apt-get), or you can download it from the [project page](http://bedtools.readthedocs.org/en/latest/content/installation.html) and compile it from source.
For both bwa and bedtools, make sure you know the path to the respective executables, as they need to be specified in the pipeline manifest file.
Input
Writing A Manifest File
When running the end-to-end analysis functionality of the guideseq package, a number of inputs are required. To simplify the formatting of these inputs and to encourage reproducibility, these parameters are inputted into the pipeline via a manifest formatted as a YAML file. YAML files allow easy-to-read specification of key-value pairs. This allows us to easily specify our parameters. The following fields are required in the manifest:
reference_genome: The absolute path to the reference genome FASTA file.
output_folder: The absolute path to the folder in which all pipeline outputs will be saved.
bwa: The absolute path to the bwa executable
bedtools: The absolute path to the bedtools executable
PAM: PAM sequence (optional), default is NGG.
- undemultiplexed: The absolute paths to the undemultiplexed paired end sequencing files. The required parameters are:
forward: The absolute path to the FASTQ file containing the forward reads.
reverse: The absolute path to the FASTQ file containing the reverse reads.
index1: The absolute path to the FASTQ file containing the forward index reads.
index2: The absolute path to the FASTQ file containing the reverse index reads.
An example undemultiplexed field:
undemultiplexed:
                                forward: ../test/data/undemux.r1.fastq.gz
                                reverse: ../test/data/undemux.r2.fastq.gz
                                index1: ../test/data/undemux.i1.fastq.gz
                                index2: ../test/data/undemux.i2.fastq.gz
- samples: A nested field containing the details of each sample. At least two samples must be specified: a “control” sample (to be used to filter out background off-target sites) and at least one treatment sample. The required parameters are:
target: The sample targetsites
barcode1: The forward barcode
barcode2: The reverse barcode
description: A description of the sample
An example samples field:
samples:
                                control:
                                                                target:
                                                                barcode1: CTCTCTAC
                                                                barcode2: CTCTCTAT
                                                                description: Control

                                [SAMPLENAME]:
                                                                target: GAGTCCGAGCAGAAGAAGAANGG
                                                                barcode1: TAGGCATG
                                                                barcode2: TAGATCGC
                                                                description: EMX1
### A Full Manifest File Example<a name=”manifest_example”></a>
Below is an example of a full manifest file. Feel free to copy it and replace the parameters with your own experiment data. Remember that you can input more than just one treatment sample (e.g. the “EMX1” data below).
reference_genome: test/test_genome.fa
output_folder: test/output

bwa: bwa
bedtools: bedtools
PAM: NGG
demultiplex_min_reads: 1000

undemultiplexed:
                                forward: test/data/undemultiplexed/undemux.r1.fastq.gz
                                reverse: test/data/undemultiplexed/undemux.r2.fastq.gz
                                index1: test/data/undemultiplexed/undemux.i1.fastq.gz
                                index2: test/data/undemultiplexed/undemux.i2.fastq.gz

samples:
                                control:
                                                                target:
                                                                barcode1: CTCTCTAC
                                                                barcode2: CTCTCTAT
                                                                description: Control

                                EMX1:
                                                                target: GAGTCCGAGCAGAAGAAGAANGG
                                                                barcode1: TAGGCATG
                                                                barcode2: TAGATCGC
                                                                description: EMX_site1
Output
When running the full pipeline, the results of each step are outputted to the output_folder in a separate folder for each step. The output folders and their respective contents are as follows:
Output Folders
output_folder/demultiplexed: Contains the four undemultiplexed reads files (forward, reverse, index1, index2) for each sample.
output_folder/umitagged: Contains the two umitgged reads files (forward, reverse) for each sample.
output_folder/consolidated: Contains the two consolidated reads files (forward, reverse) for each sample.
output_folder/aligned: Contains an alignment .sam file for each sample.
output_folder/identified: Contains a tab-delimited .txt file for each sample with an identified off-target in each row.
output_folder/filtered: Contains a tab-delimited .txt file for each sample containing the identified DSBs that are background sites (not off-targets)
output_folder/visualization: Contains a .svg vector image representing an alignment of all detected off-targets to the targetsite for each sample.
The final detected off-target sites are placed in the output_folder/identified folder, with one .txt file for each sample specified in the manifest. The fields that are populated in each row of these off-target files are specified below:
Output Off-Targets .txt Fields
BED Chromosome: Window chromosome
BED Min.Position: Window 0-based start position
BED Max.Position: Window 0-based end position
BED Name: Name of window
Filename: The name of the current .SAM file used in analysis.
WindowIndex: Index number of window
Chromosome: Chromosome corresponding to position with maximum reads in window (matches BED Chromosome)
Position: Position with maximum number of reads in window
Sequence: The window sequence, starting 25 bp upstream and ending 25 bp downstream of Chromosome:Position
+.mi: Number of forward reads with distinct molecular indices
-.mi: Number of reverse reads with distinct molecular indices
bi.sum.mi: Sum of the +.mi and -.mi fields (GUIDE-seq Read Count)
bi.geometric_mean.mi: Geometric mean of the +.mi and -.mi fields
+.total: Total number of forward mapping reads
-.total: Total number of reverse mapping reads
total.sum: Sum of +.total and -.total fields
total.geometric_mean: Geometric mean of the +.total and -.total fields
primer1.mi: Number of reads amplified by forward primer with distinct molecular indices
primer2.mi: Number of reads amplified by reverse primer with distinct molecular indices
primer.geometric_mean: Geometric mean of the primer1.mi and primer2.mi fields
position.stdev: Standard deviation of positions within genomic window
Off-Target Sequence: Off-target sequence derived from genome reference
Mismatches: Number of mismatches between the intended target sequence and the off-target sequence
Length: Length of the target sequence
BED off-target Chromosome: Off-target chromosome
BED off-target start: Off-target 0-based start position
BED off-target end: Off-target 0-based end position
BED off-target name: Off-target name
BED Score: Field to conform to standard BED format
Strand: Indicates the strand of detected off-target site. + for forward strand and - for reverse strand
Cells: Cell type
Target site: Targetsite name
Target Sequence: Intended target site sequence (including PAM)
The key fields for interpreting this output and identifying off-target sites are: BED off-target Chromosome, BED off-target start, BED off-target end, BED off-target name, BED off-target strand, Off-Target Sequence, bi.sum.mi
Output Visualizations
The outputted visualizations are in the .svg vector format, which is an open image standard that can be viewed in any modern web browser (e.g. Google Chrome, Apple Safari, Mozilla Firefox), and can be viewed and edited in any vector editing application (e.g. Adobe Illustrator). Because the output visualizations are vector images, they can be scaled up or down infinitely without a loss in quality, and can also be edited as shapes with ease. This makes the images produced by the guideseq package ideal for posters, presentations, and papers.
Usage
git clone https://github.com/tsailabSJ/guideseq

cd guideseq/test

guideseq.py all -m test_manifest.yaml
Running the Full Analysis Pipeline
To run the full guideseq analysis pipeline, you must first create a manifest YAML file that describes all pipeline inputs. Once you have done so, you can simply run
guideseq.py all -m /path/to/manifest.yaml
to run the entire pipeline. Below are specific instructions detailing how to write the manifest file.
If you wish to run an example on our abridged test data, you can simply run
cd guideseq/test

guideseq.py all -m test_manifest.yaml
from the guideseq root directory. The test_manifest assumes that both the bwa and bedtools`executables are in your system PATH. You will see the pipeline results outputted to the `test/output folder.